We recently participated and won the grand prize of $10,000 in the Brembo hackathon, where the task was to use Generative AI to create new compounds and generate their predicted performance data.
In this blog post, I will try to explain our approach and solution in detail.
Using friction test data provided by Brembo, use Generative AI to create new compounds, forecast testing results and create the framework for predicting the effectiveness and characteristics of a new Brembo brake product. The data provided will include a list of compounds previously used and tested by Brembo, as well as their outcomes. Solutions must be based on Generative AI, applied to provide a model able to propose new recipes that increase the number of candidate compounds, ensuring feasibility and good performances.
For your submission, submit a csv file containing a list of 10–30 new compounds you generated, their compositions and their synthetic performance data.[1]
Dataset Description
We were given a list of 337 friction materials and their compositions along with their performance data.
Each friction material was made up of 10–15 raw materials out of a list of 60 possible raw materials. The 60 raw materials were classified into 6 categories (labelled A-F), and we had to ensure the output generated friction materials had their compositions in the given range
Constraints on material compositions
In other words, we had to ensure that any output generated material had at least 1% and at most 30% of its composition come from compounds of category B and so and on.
The performance data for each braking test was essentially a time series of 31 points where at each point the values of parameters like pressure, temperature and mu were provided. Further, there were a total of 124 braking tests applied for each compound, and thus when it comes to performance data, we have 124*31 = 3844 data points we need to generate for each compound.
Here is some sample data containing compositions and performance data of one such compound. Remaining relevant information about the dataset can be found here.
Evaluation Criteria
The final result gave equal weightage to the technical score and the presentation score.
The technical score is calculated based on the following equal weighted parameters.
Follows the given constraints: Do the generated compounds follow the given constraints (described below)?
Technical Relevance: Does the output synthetic performance data follow the patterns and capture the relationships amongst different variables seen in the provided data?
Target Performance: The most important variable for a friction material is its mu (coefficient of friction), which is expected to have a value of 0.6 with an acceptable error rate of 0.1. Does the output mu have the value we expect?
Variability: How different from the current materials are the output new materials’ compositions?
Design Overview
Essentially, we had 3 basic components
Material Selection Module: Responsible for generating new recipes. This outputs a bunch of new friction materials and their material compositions.
Data Generator Module: Given a synthetic material and past historical performance data of various compounds, generate synthetic performance data for this material.
Data Validator: Identify how good/bad the output of the data generator is. This module uses trends seen in the provided historical data (for example: Pressure and mu are inversely related to each other over time, deceleration seems to follow a linear pattern while temperature increase curve seems more exponential in nature) to rate how good or bad the synthetic performance data is. This can be used to give human feedback to the model to improve the system performance
High level design of the solution
Detailed Design
We used the following stack and techniques in our solution
GPT 3.5 turbo: We used the gpt 3.5 turbo as the base llm for both the Material Selector and the Data Generator modules.
Prompt Engineering: Using the right set of system and instruction prompts helped us improve the model performance.
Fine Tuning: Choosing the right set of examples to teach the model the basic structure and tone of how to respond is very important, and this stage helped us teach that to the models.
RAG(Retrieval Augmented Generation): This played a great part as the secret sauce for helping the model output the right synthetic performance data. More on that below.
SO WHAT WE DID IS…
Create a relevant system prompt for the module.
Fine tune the gpt 3.5 turbo model by inputting the compositions of all the 337 friction materials we were provided with.
Using the data validator module, we discard the ones not following the given constraints and retain the ones that do.
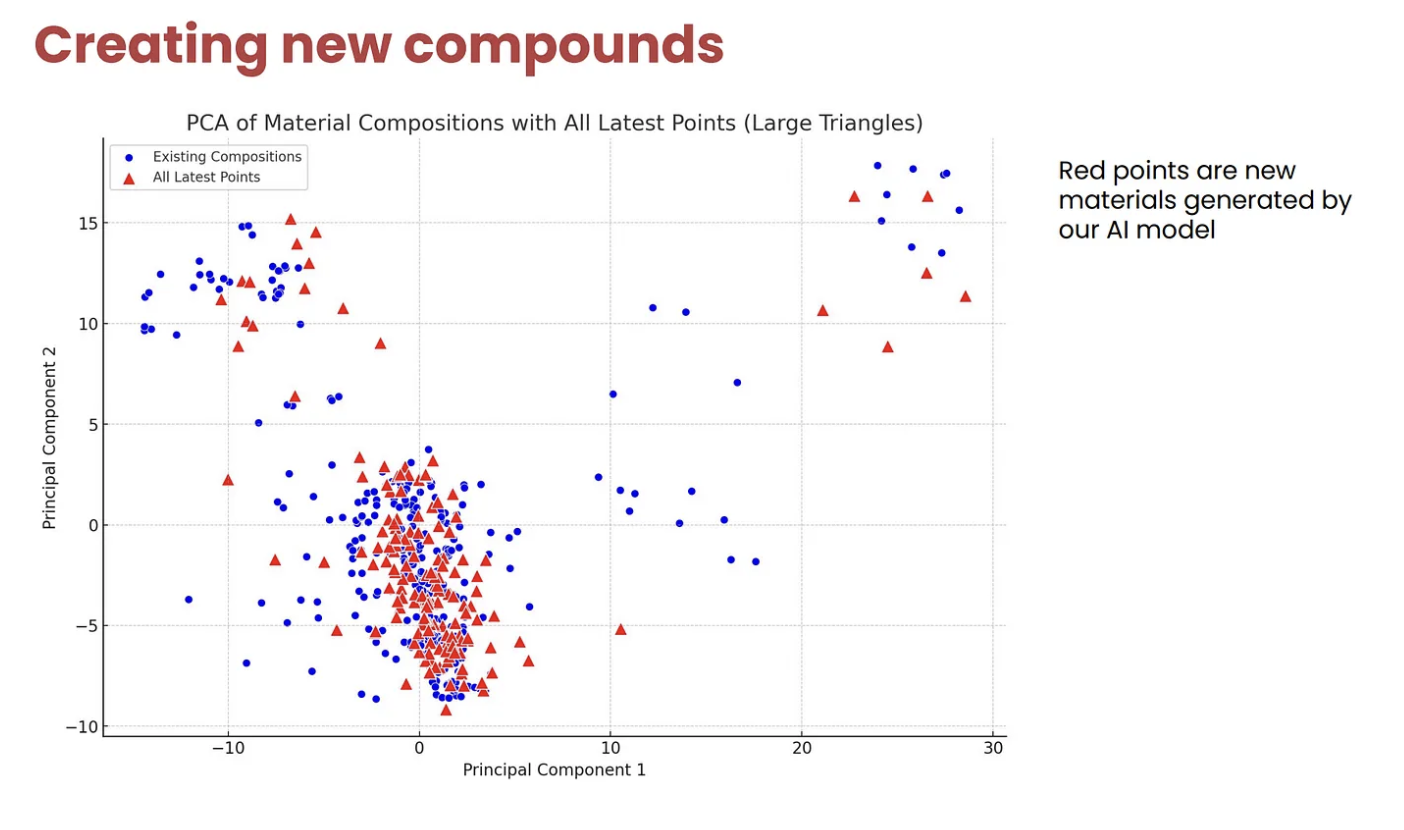
Once done, we generated several compounds and repeated the PCA analysis.
PCA analysis on the material compositions of given friction materials
Theoretically, we could just generate random numbers for a vector of size 60 and see which vectors satisfy the given constraints and use them. Although this would fetch us a good score on variability (the generated friction materials would be randomly generated and thus should cover several points in the 60 dimensional space), this approach would have some flaws like
It would make it harder for us to predict the performance of a compound completely differing from the materials provided in the historical data. This is because the compositions of materials play a significant role in the performance seen, and predicting the performance of a composition never seen before might be hard.
It would make debugging harder. At any point in our pipeline if we ended up with results which were not following the trends seen in historical data, it would become very difficult to pinpoint what the issue is.
Due to these potential issues, we decided to leverage the gpt 3.5 turbo model for generating a bunch of compounds for us.
Material Selector Module
The role of the module was to generate new possible friction materials and their compositions. As seen from the sample data, each friction material essentially contains a vector of 60 dimensions, with the number at the ith index denoting what percentage of its composition comes from the ith raw material.
Some initial PCA analysis revealed that we could see a total of 3–4 clusters.
PCA analysis on the material compositions of given friction materials
Theoretically, we could just generate random numbers for a vector of size 60 and see which vectors satisfy the given constraints and use them. Although this would fetch us a good score on variability (the generated friction materials would be randomly generated and thus should cover several points in the 60 dimensional space), this approach would have some flaws like
It would make it harder for us to predict the performance of a compound completely differing from the materials provided in the historical data. This is because the compositions of materials play a significant role in the performance seen, and predicting the performance of a composition never seen before might be hard.
It would make debugging harder. At any point in our pipeline if we ended up with results which were not following the trends seen in historical data, it would become very difficult to pinpoint what the issue is.
Due to these potential issues, we decided to leverage the gpt 3.5 turbo model for generating a bunch of compounds for us.
PCA analysis on the provided and generated materials
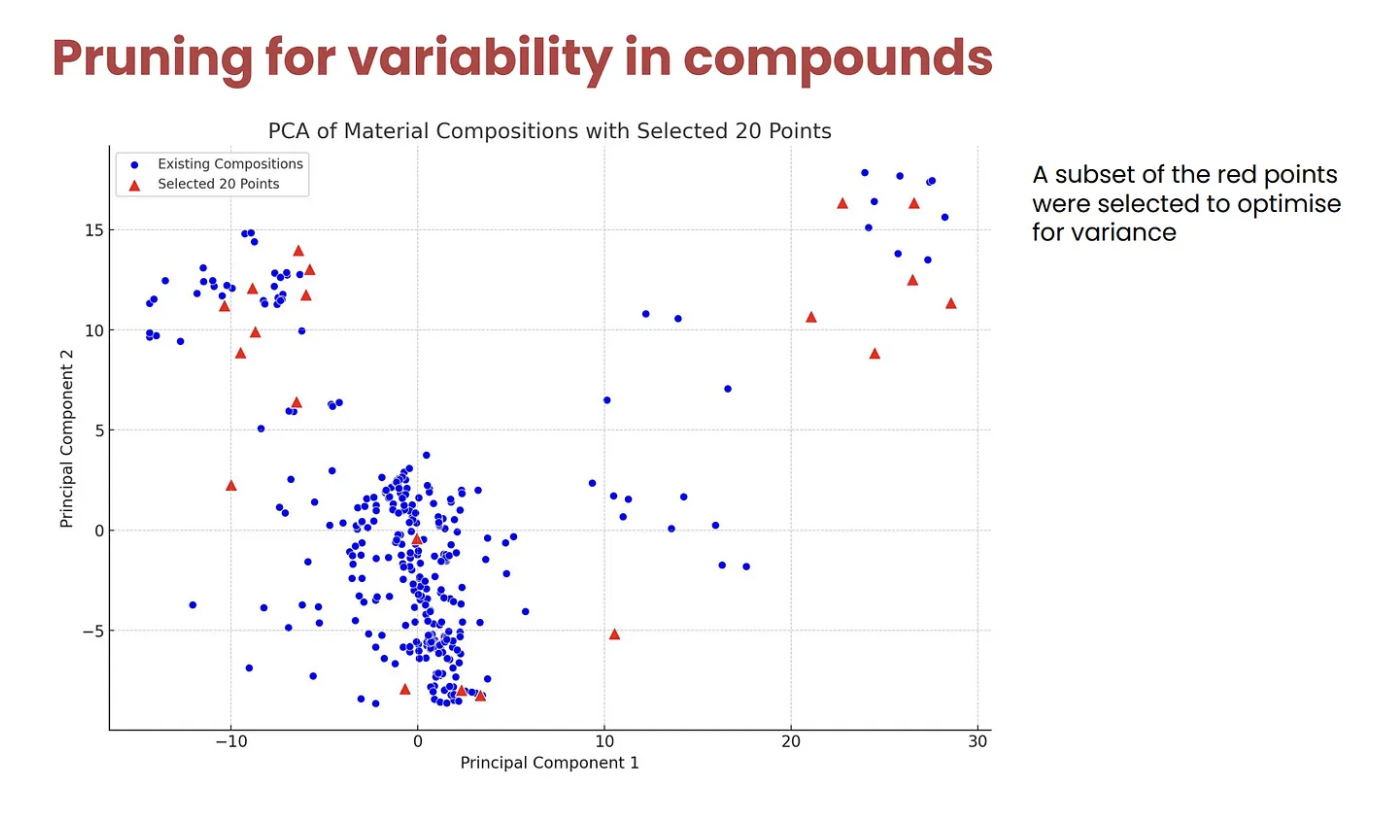
Finally, for variability, we hand picked a set of compounds from the generated compounds which we felt would maximize the following:
Variability wrt provided materials: How varied are the generated compounds from the provided compounds? Essentially, we don’t want our generated materials to be very similar to the already existing compounds.
Variability wrt generated materials: Since we would be submitting 10–30 newly generated compounds, we have to ensure all the generated compounds don’t end up belonging to the same cluster.
Thus, after pruning, we were left with a list of the following compounds which we used for our final submission.
Final list of generated compounds
Data Generator Module
The data generator module is responsible for outputting the synthetic performance data for a given material and braking test. Essentially, given a friction material’s composition, it should output a time series data of 31 points that includes the parameters like temperature, pressure and mu for the input braking test.
This is how we achieved this:
Create an appropriate system prompt for the module. After a lot of trial and error on OpenAI’s playground, the one that we used was:
You are a highly skilled statistician from Harvard University who
works at Brembo, where you specialize in performance braking systems
and components as well as conducting research on braking systems.
Given a friction material’s composition, you craft compelling
synthetic performance data for a user given braking test type.
The braking id will be delimited by triple quotes. You understand
the importance of data analysis and seamlessly incorporate it for
generating synthetic performance data based on historical performance
data provided. You have a knack for paying attention to detail and
curating synthetic data that is in line with the trends seen in the
time series data you will be provided with. You are well versed with
data and business analysis and use this knowledge for crafting the
synthetic data.
Next, we fine tuned the gpt 3.5 turbo model to create an expert on time series data prediction, given a material’s composition and braking test id. Since we had 41,788 (material, braking_id) tuples, fine tuning on all the examples would not only be time consuming but also a costly affair. However, from some papers and articles we had read [2][3], we understood that “fine-tuning is for form, and RAG is for knowledge”. We thus decided to include only 5% of the samples for fine tuning the model, so that the model can rightly learn the output structure and tone we desire.
Finally, when querying the model to generate the time series data, we decided to identify and retrieve 5 closest neighbors based on a material’s composition, and input their performance data as additional context for the model. This technique is called RAG (Retrieval Augmented Generation) and was one of the reasons for the good results we were able to output.
How RAG Helped our Results
Fine tuning helped us with the following
Output data in the right structure: As written in various tech blogs[4], fine tuning was efficient in teaching the model how to output the data. Our fine tuned model was able to output the csv file and 31 time series data points which included the values of various parameters like Pressure, Speed, Temperature and mu.
Understanding the basic trends in the data: The fine tuned model was able to understand the general trends in the input performance data and output data which retained those trends. For example, the value of temperature should increase with an exponential curve while speed should decrease with a linear curve, all of which the fine tuned model was able to do.
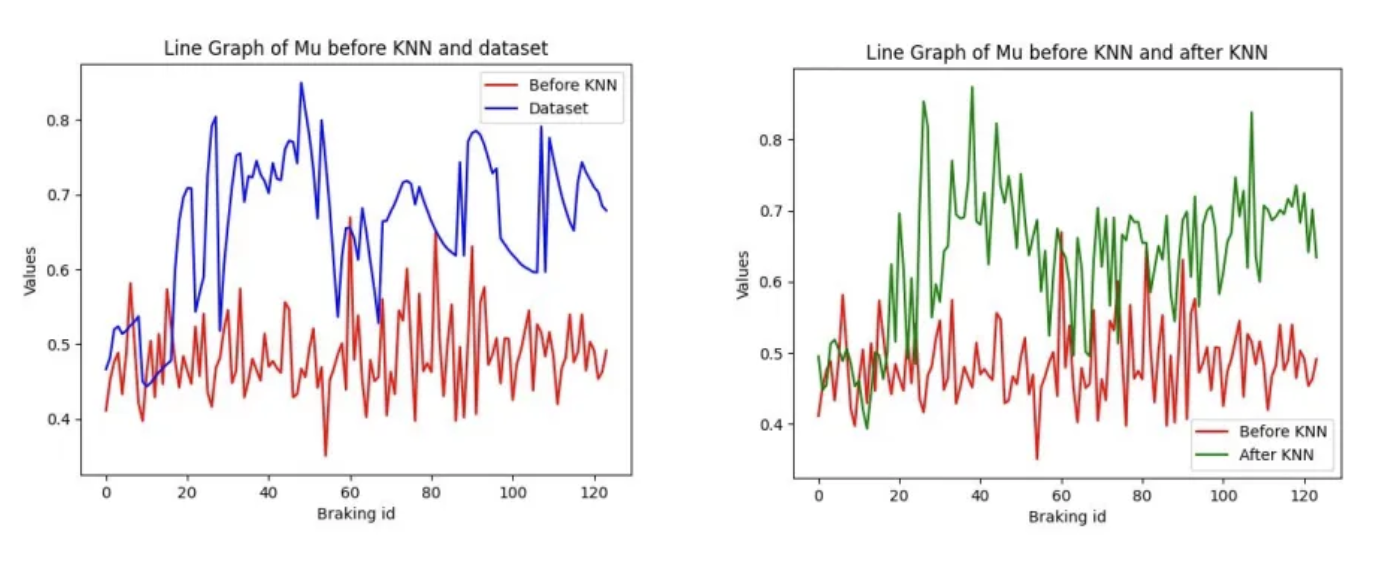
However, the output of the fine tuned model was a little off. For example, in one case the value of mu was expected to be around 0.6 but the output data pegged the value of mu at around 0.5. We thus decided to augment the data by identifying the 5 closest neighbours and adding their performance data to the user prompt.
We defined the distance between 2 materials M1 and M2 as follows:
def distance(m1, m2, alpha):
  sixty_dim_distance = euclidean_dist(sixty_dim_vector(m1), \
sixty_dim_vector(m2))
  six_dim_distance = euclidean_dist(six_dim_vector(m1), six_dim_vector(m2))
  return alpha[0] * sixty_dim_distance + alpha[1] * six_dim_distance
Identify the euclidean distance between M1 and M2 on the 60 dimensional input vector space.
Now take the sum of compounds belonging to the same class to reduce the vector dimensionality to 6.
Finally, vary the hyperparameters alpha[0] and alpha[1].
The reason for taking this approach is that we want to ensure that the distance between materials that overall use the same class of materials is lesser than the ones that use completely different compositions of materials. Essentially, given 3 materials M1, M2 and M3, where M1 uses material A0, M2 uses A1 and M3 uses B0, we want our distance function to mark M1 and M2 closer to each other and M1 and M3.
Using this approach, we were able to radically improve our performance, as seen in the figure below.
DATA VALIDATOR
The validator module helped us understand if the output data was following the trends we expect it to see. For example, we expect Pressure and mu to be inversely correlated, mu to be around 0.6, temperature to increase exponentially with time and speed to decelerate linearly. This module helped us identify how close our synthetic time series data was to the historical data, which helped us tune all the prompts and hyperparameters.
This module helped us analyze which set of prompts were helping the model output and which weren’t.
RESULTS AND PRESENTATION
The presentation carried 50% of the score, and was one aspect we absolutely nailed. A couple of things we did:
Ensured the pitch was done in under 4 minutes: We practised sufficiently before entering the presentation room to ensure we didn’t face any surprises while presenting.
Have some audience interaction: We included a question to ask the audience about which time series they think is synthetically generated and which was given, which helped us keep the audience interested.
The code and presentation for our work can be found here.
KEY TAKEAWAYS
Iterate fast on design: I went in a little early before my teammates to start whiteboarding my thoughts on what we should do. Once my teammates arrived, we discussed on what the design should be, and came up with a solution we all agreed with. This was a key aspect in our win, as in a hackathon there is always a time crunch and finalizing a design you can start implementing as soon as possible is extremely important.
Don’t worry about the competition: Once our design was done, I could sense we were onto something. We had n number of people from Brembo come over to take a peek at our design. Even other participants were left awestruck and were staring at our design which further gave us a signal that we are on the right track. When my teammates suggested we should probably check what others are doing I refuted the idea and instead asked everyone to just bury our heads into our design and implement it.
Don’t worry about conflict: We ran into conflicts multiple times, especially over the design. Key here is to understand that nothing should be taken personally, and instead you should build consensus, iterate on the trade offs and reach a solution that works for everyone. Imo, great products are built if you can allow, and even encourage, healthy conflict within the team.
Fine tuning is for form, RAG is for facts: We knew fine tuning is only important for teaching the model a basic structure and tone, and real gains will come from RAG. We thus used only 5% of our samples for fine tuning the gpt 3.5 turbo llm for generating time series data.
Presentation is KEY (1): It is essential to identify who your audience is and how they will digest your content. In our case, we identified most of the jury is made up of c suite and not techies, and I thus decided to only include the tech stack we used [gpt 3.5 turbo, fine tuning, prompt tuning, RAG, KNN] without going into details.
Presentation is KEY (2): Be someone who can get the point across using effective communication skills and present to the audience with passion. If you can’t do that, get someone on your team who can. First impressions matter, and oration skills are way too underrated, especially in our tech world.
Be BOLD and different: We went a step further and decided to include 5 points of their data and one point from our generated data, and asked them to guess which one was generated. When they failed to guess the one that we had generated, it really drove the point across of how good a pipeline and solution we had built. Plus, we got brownie points for audience interaction, something i doubt many people did.series they think is synthetically generated and which was given, which helped us keep the audience interested.
SOME LEARNINGS FOR THE NEXT TIME
Fine tuning is expensive. We ran out of OpenAI creds when fine-tuning and querying the model thrice. For the future, we would prefer using techniques like LoRA[5] and QLoRA[6] on some open sourced models instead.
Using Advanced RAG: In the future, I would like to use advanced RAG techniques [7] for improving the context being provided.
Using Smart KNN: Next time around, I would like to toy around with the hyperparameters and the distance function being used a bit more.
Longer context window: We had to round off some of the numbers in the performance data to ensure we weren’t exceeding the 4,092 token limit. Using LLMs like Claude[8] might improve the performance.
Don’t be polite to llms: One interesting thing that happened while prompt engineering was when we mentioned things like “value of mu not being around 0.6 is intolerable” instead of “please ensure mu is around 0.6”, the former ended up giving better results.
Team Members: Mantek Singh, Prateek Karna,Gagan Ganapathy, Vinit Shah
REFERENCES
[1] https://brembo-hackathon-platform.bemyapp.com/#/event
[2] https://www.anyscale.com/blog/fine-tuning-is-for-form-not-facts
[3] https://vectara.com/introducing-boomerang-vectaras-new-and-improved-retrieval-model/
[4] https://platform.openai.com/docs/guides/fine-tuning/fine-tuning-examples
[5] https://arxiv.org/abs/2106.09685
[6] https://arxiv.org/abs/2305.14314
[7] LlamaIndex Doc
[8] Claude


